Grundlæggende statistik
| Institutionelle ejere | 377 total, 360 long only, 0 short only, 17 long/short - change of 10,31% MRQ |
| Gennemsnitlig porteføljeallokering | 0.4663 % - change of -4,81% MRQ |
| Institutionelle aktier (lange) | 150.695.910 (ex 13D/G) - change of -13,43MM shares -3,04% MRQ |
| Institutionel værdi (lang) | $ 4.916.179 USD ($1000) |
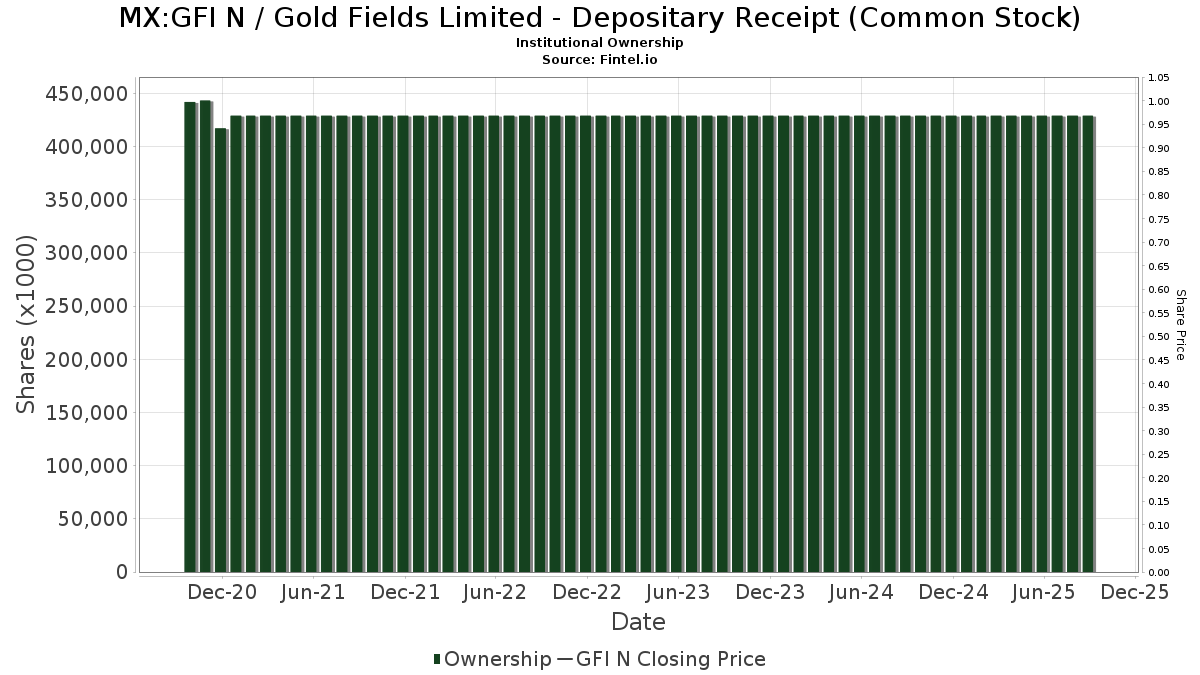
Institutionelt ejerskab og aktionærer
Gold Fields Limited - Depositary Receipt (Common Stock) (MX:GFI N) har 377 institutionelle ejere og aktionærer, der har indsendt 13D/G- eller 13F-formularer til Securities Exchange Commission (SEC). Disse institutioner har i alt 150,695,910 aktier. Største aktionærer omfatter Van Eck Associates Corp, BlackRock, Inc., Robeco Institutional Asset Management B.V., Deutsche Bank Ag\, Arrowstreet Capital, Limited Partnership, Dimensional Fund Advisors Lp, American Century Companies Inc, Goldman Sachs Group Inc, Invesco Ltd., and Man Group plc .
Gold Fields Limited - Depositary Receipt (Common Stock) (BMV:GFI N) institutionel ejerskabsstruktur viser aktuelle positioner i virksomheden efter institutioner og fonde, samt seneste ændringer i positionsstørrelse. Større aktionærer kan omfatte individuelle investorer, investeringsforeninger, hedgefonde eller institutioner. Skema 13D angiver, at investoren besidder (eller besidder) mere end 5 % af virksomheden og har til hensigt (eller har til hensigt at) aktivt at forfølge en ændring i forretningsstrategi. Skema 13G indikerer en passiv investering på over 5%.
Fondens stemningsscore
Fund Sentiment Score (fka Ownership Accumulation Score) finder de aktier, der bliver mest købt af fonde. Det er resultatet af en sofistikeret, multi-faktor kvantitativ model, der identificerer virksomheder med de højeste niveauer af institutionel akkumulering. Scoringsmodellen bruger en kombination af den samlede stigning i oplyste ejere, ændringerne i porteføljeallokeringer i disse ejere og andre målinger. Tallet går fra 0 til 100, hvor højere tal indikerer et højere niveau af akkumulering for sine jævnaldrende, og 50 er gennemsnittet.
Opdateringsfrekvens: Dagligt
Se Ownership Explorer, som giver en liste over højest rangerende virksomheder.
AI+ Ask Fintel’s AI assistant about Gold Fields Limited - Depositary Receipt (Common Stock).
Select a question to share a public post with an AI-crafted answer.
Thinking of good questions…
13F og NPORT arkivering
Detaljer om 13F-arkivering er gratis. Detaljer om NP-ansøgninger kræver et premium-medlemskab. Grønne rækker angiver nye positioner. Røde rækker angiver lukkede positioner. Klik på linket ikon for at se den fulde transaktionshistorik.
Opgrader
for at låse premium-data op og eksportere til Excel ![]() .
.
| Fil dato | Kilde | Investor | Type | Gennemsnitlig pris (Øst) |
Aktier | Δ Aktier (%) |
Rapporteret Værdi ($1000) |
Δ Værdi (%) |
Port Alloc (%) |
|
|---|---|---|---|---|---|---|---|---|---|---|
| 2026-02-04 | 13F | First Eagle Investment Management, LLC | 3.538.081 | -1,36 | 154.473 | 2,63 | ||||
| 2026-02-13 | 13F | Flow Traders U.s. Llc | 5.774 | -44,94 | 0 | |||||
| 2026-04-06 | 13F | Rosenberg Matthew Hamilton | 1.146 | 0,00 | 52 | 4,00 | ||||
| 2026-02-12 | 13F | Mark Sheptoff Financial Planning, Llc | 1.552 | 23,96 | 68 | 28,85 | ||||
| 2026-02-11 | 13F | Winton Capital Group Ltd | 5.300 | 231 | ||||||
| 2026-04-17 | 13F | RFG Advisory, LLC | 31.930 | 19,69 | 1.450 | 24,48 | ||||
| 2026-02-17 | 13F | Summit Global Investments | 40.608 | -12,11 | 2 | 0,00 | ||||
| 2026-02-03 | 13F | Manning & Napier Advisors Llc | 79.439 | -2,36 | 3.505 | 2,67 | ||||
| 2026-03-12 | 13F/A | Peak6 Llc | Put | 900 | 39 | |||||
| 2026-03-12 | 13F/A | Peak6 Llc | Call | 334.200 | -7,63 | 14.591 | -3,89 | |||
| 2025-11-14 | 13F | Virtu Financial LLC | 0 | -100,00 | 0 | |||||
| 2026-02-12 | 13F | Penserra Capital Management LLC | 52.349 | -31,19 | 2 | -33,33 | ||||
| 2026-03-06 | 13F | Hsbc Holdings Plc | 111.152 | 160,55 | 4.856 | 171,23 | ||||
| 2026-02-13 | 13F | Barclays Plc | 57.712 | -11,09 | 2.520 | -7,49 | ||||
| 2026-04-02 | 13F | Marex Group plc | 0 | -100,00 | 0 | -100,00 | ||||
| 2025-11-13 | 13F | Marshall Wace, Llp | 0 | -100,00 | 0 | |||||
| 2026-02-09 | 13F | William Blair Investment Management, Llc | 25.676 | 1.121 | ||||||
| 2026-02-11 | 13F | Picton Mahoney Asset Management | 322.907 | -14,74 | 14.098 | 93.886,67 | ||||
| 2026-04-15 | 13F | Financial Management Professionals, Inc. | 872 | 0,00 | 40 | 2,63 | ||||
| 2026-02-13 | 13F | Cornerstone Financial Management LLC | 45 | 2 | ||||||
| 2026-04-07 | 13F | Mb, Levis & Associates, Llc | 0 | -100,00 | 0 | |||||
| 2026-04-07 | 13F | Park Avenue Securities Llc | 37.448 | 2 | ||||||
| 2026-02-13 | 13F | Causeway Capital Management Llc | 1.621.076 | 5,06 | 70.776 | 9,32 | ||||
| 2026-02-11 | 13F | IMA Wealth, Inc. | 34 | 1 | ||||||
| 2026-02-05 | 13F | Park Square Financial Group, LLC | 0 | -100,00 | 0 | |||||
| 2026-02-10 | 13F | Norges Bank | 600.000 | -27,12 | 26.196 | 506,11 | ||||
| 2026-01-26 | 13F | Cwm, Llc | 12.912 | 518,98 | 1 | |||||
| 2026-01-15 | 13F | Burns Matteson Capital Management, LLC | 11.238 | 10,04 | 491 | 14,49 | ||||
| 2026-01-14 | 13F | ORG Wealth Partners, LLC | 221 | 5,24 | 10 | 12,50 | ||||
| 2026-04-09 | 13F | Moody National Bank Trust Division | 5.336 | -11,57 | 242 | -7,98 | ||||
| 2026-02-13 | 13F | OMERS ADMINISTRATION Corp | 0 | -100,00 | 0 | |||||
| 2026-02-12 | 13F | Sprott Inc. | 77.919 | -1,73 | 3.402 | 2,25 | ||||
| 2026-02-17 | 13F | Old Mission Capital Llc | 0 | -100,00 | 0 | |||||
| 2026-02-09 | 13F | Hantz Financial Services, Inc. | 23.276 | 63,98 | 1 | |||||
| 2026-01-29 | 13F | UBS Group AG | 431.069 | 9,00 | 18.820 | 13,41 | ||||
| 2026-02-17 | 13F | DV Trading LLC | 100 | 4 | ||||||
| 2026-01-26 | 13F | Private Trust Co Na | 280 | -60,45 | 12 | -58,62 | ||||
| 2026-02-12 | 13F | Advisors Asset Management, Inc. | 75.374 | 2,10 | 3.291 | 6,23 | ||||
| 2026-02-17 | 13F | Caption Management, LLC | Call | 238.000 | 9,17 | 10.391 | 13,60 | |||
| 2026-02-19 | 13F | Invesco Ltd. | 3.819.026 | -7,09 | 166.739 | -3,33 | ||||
| 2026-02-11 | 13F | Simplex Trading, Llc | 13.076 | 571 | ||||||
| 2026-02-11 | 13F | Simplex Trading, Llc | Call | 228.300 | -17,82 | 9.968 | 90.509,09 | |||
| 2026-02-17 | 13F | DZ BANK AG Deutsche Zentral Genossenschafts Bank, Frankfurt am Main | 0 | -100,00 | 0 | -100,00 | ||||
| 2026-02-11 | 13F | Simplex Trading, Llc | Put | 226.200 | -11,54 | 9.876 | 98.650,00 | |||
| 2026-02-18 | 13F | EP Wealth Advisors, Inc. | 4.984 | 218 | ||||||
| 2026-04-27 | 13F | Pensionmark Financial Group, Llc | 16.761 | 4,39 | 761 | 8,42 | ||||
| 2026-02-17 | 13F | Asset One Wealth Management LLC | 16.082 | 803 | ||||||
| 2026-01-20 | 13F | Coastal Investment Advisors, Inc. | 0 | -100,00 | 0 | |||||
| 2026-04-08 | 13F | Wealth Enhancement Advisory Services, Llc | 0 | -100,00 | 0 | |||||
| 2026-02-11 | 13F | Empowered Funds, LLC | 587.912 | 5.514,13 | 25.668 | 5.746,92 | ||||
| 2026-02-13 | 13F | JustInvest LLC | 33.488 | 10,08 | 1.462 | 14,58 | ||||
| 2026-04-10 | 13F | Naviter Wealth, LLC | 12.514 | 6,99 | 568 | 11,37 | ||||
| 2026-02-03 | 13F | Crossmark Global Holdings, Inc. | 15.715 | -2,57 | 686 | 1,48 | ||||
| 2026-02-12 | 13F | Callan Family Office, LLC | 29.365 | 82,80 | 1.282 | 90,21 | ||||
| 2026-02-17 | 13F | Wellington Management Group Llp | 0 | -100,00 | 0 | |||||
| 2026-04-20 | 13F | Dagco, Inc. | 100 | 0,00 | 5 | 0,00 | ||||
| 2026-02-17 | 13F | Dv Equities, Llc | 2.100 | 92 | ||||||
| 2026-02-17 | 13F | Engineers Gate Manager LP | 55.693 | 2.432 | ||||||
| 2025-11-13 | 13F | Dynamic Technology Lab Private Ltd | 0 | -100,00 | 0 | -100,00 | ||||
| 2026-02-17 | 13F | Parallax Volatility Advisers, L.P. | Call | 0 | -100,00 | 0 | -100,00 | |||
| 2026-04-20 | 13F | Banque Cantonale Vaudoise | 2.670 | 121 | ||||||
| 2026-02-12 | 13F | DJE Kapital AG | 3.186.462 | -29,36 | 142.009 | 34,91 | ||||
| 2026-02-13 | 13F | Colony Group, LLC | 5.524 | -98,83 | 241 | -99,21 | ||||
| 2026-02-17 | 13F | Lazard Asset Management Llc | 1.180.878 | 3,64 | 51.557 | 7,84 | ||||
| 2026-02-17 | 13F | Raymond James Financial Inc | 132.943 | -18,78 | 5.809 | -15,43 | ||||
| 2026-02-12 | 13F | Commonwealth Equity Services, Llc | 20.864 | -95,92 | 911 | 4.233,33 | ||||
| 2026-02-12 | 13F | Hrt Financial Lp | 0 | -100,00 | 0 | |||||
| 2026-02-17 | 13F | Snowden Capital Advisors LLC | 0 | -100,00 | 0 | |||||
| 2026-04-20 | 13F | Kestra Private Wealth Services, Llc | 17.739 | -2,78 | 805 | 1,13 | ||||
| 2026-04-24 | 13F | Strs Ohio | 10.449 | -12,16 | 474 | -8,67 | ||||
| 2026-02-03 | 13F | Fulcrum Asset Management LLP | 19.405 | 228 | -79,20 | |||||
| 2026-02-11 | 13F | LPL Financial LLC | 295.226 | -9,13 | 12.890 | -5,45 | ||||
| 2026-02-05 | 13F | Elyxium Wealth, LLC | 140 | 6 | ||||||
| 2026-01-30 | 13F | Mitsubishi UFJ Trust & Banking Corp | 245.035 | 43,72 | 10.698 | 49,54 | ||||
| 2026-04-07 | 13F | Farther Finance Advisors, LLC | 12.888 | 2,60 | 620 | 13,14 | ||||
| 2026-02-05 | 13F | May Hill Capital, LLC | 4.748 | 207 | ||||||
| 2026-02-17 | 13F | Orbis Allan Gray Ltd | 2.461.373 | -7,81 | 107.464 | -4,07 | ||||
| 2026-04-13 | 13F | E Fund Management Co., Ltd. | 32.769 | 1.488 | ||||||
| 2026-02-11 | 13F | Cerity Partners LLC | 26.261 | 67,41 | 1.147 | 74,16 | ||||
| 2026-04-21 | 13F | Financial Consulate, Inc | 117 | 735,71 | 5 | |||||
| 2026-02-10 | 13F | CIBC Asset Management Inc | 125.042 | 15,66 | 5.459 | 20,35 | ||||
| 2026-03-03 | 13F/A | Caitong International Asset Management Co., Ltd | 12.697 | 554 | ||||||
| 2025-11-19 | 13F/A | Danske Bank A/s | 0 | 0 | ||||||
| 2026-02-13 | 13F | First Trust Advisors Lp | 108.243 | 7,14 | 4.726 | 11,46 | ||||
| 2026-01-14 | 13F | Hennion & Walsh Asset Management, Inc. | 5.286 | 231 | ||||||
| 2026-02-13 | 13F | Itau Unibanco Holding S.A. | 14.427 | -42,37 | 637 | -39,43 | ||||
| 2026-04-24 | 13F | Root Financial Partners, LLC | 28 | 1 | ||||||
| 2025-11-14 | 13F | Wetherby Asset Management Inc | 41.602 | 4,99 | 1.746 | 86,23 | ||||
| 2026-04-06 | 13F | Versant Capital Management, Inc | 17 | 1 | ||||||
| 2026-04-10 | 13F | Marshall Financial Group LLC | 30.735 | 1,34 | 1.395 | 5,36 | ||||
| 2026-04-23 | 13F | MQS Management LLC | 0 | -100,00 | 0 | |||||
| 2026-02-13 | 13F | American Century Companies Inc | 4.538.613 | 9,71 | 198.156 | 14,16 | ||||
| 2026-04-20 | 13F | Jfs Wealth Advisors, Llc | 1.001 | 0,00 | 45 | 4,65 | ||||
| 2026-02-13 | 13F | Parkside Financial Bank & Trust | 91 | 0,00 | 4 | 0,00 | ||||
| 2025-11-14 | 13F | Wolverine Trading, Llc | 17.870 | 741 | ||||||
| 2026-02-12 | 13F | Hollencrest Capital Management | 6.274 | 0,00 | 274 | 3,80 | ||||
| 2025-11-14 | 13F | Wolverine Trading, Llc | Call | 111.900 | 4.637 | |||||
| 2025-11-14 | 13F | Wolverine Trading, Llc | Put | 53.400 | 2.213 | |||||
| 2026-02-06 | 13F | EverSource Wealth Advisors, LLC | 2.944 | -1,27 | 129 | 2,40 | ||||
| 2026-02-17 | 13F | Bamco Inc /ny/ | 0 | -100,00 | 0 | |||||
| 2026-02-17 | 13F | Driehaus Capital Management Llc | 0 | -100,00 | 0 | -100,00 | ||||
| 2026-04-22 | 13F | Traveka Wealth, LLC | 5.745 | 1,02 | 261 | 4,84 | ||||
| 2026-04-21 | 13F | Vise Technologies, Inc. | 21.926 | 0,00 | 957 | 0,00 | ||||
| 2026-02-03 | 13F | Denali Advisors Llc | 7.073 | -0,99 | 309 | 3,01 | ||||
| 2026-02-13 | 13F | Walleye Trading LLC | Call | 117.600 | -50,19 | 5.134 | -48,17 | |||
| 2025-11-10 | 13F | MAI Capital Management | 0 | -100,00 | 0 | |||||
| 2026-02-13 | 13F | Walleye Trading LLC | Put | 119.700 | -4,24 | 5.226 | -0,36 | |||
| 2026-01-23 | 13F | Factory Mutual Insurance Co | 91.692 | -24,84 | 4.003 | -21,80 | ||||
| 2026-04-16 | 13F | Diversified Trust Co | 8.045 | -0,32 | 365 | 3,69 | ||||
| 2026-01-30 | 13F | Sigma Planning Corp | 55.407 | 203,67 | 2.419 | 216,21 | ||||
| 2026-02-09 | 13F | Fisher Asset Management, LLC | 4.895 | 214 | ||||||
| 2026-02-02 | 13F | Benjamin Edwards Inc | 6.768 | 0,89 | 295 | 4,98 | ||||
| 2026-02-02 | 13F | Principal Financial Group Inc | 94.833 | 6,97 | 4.140 | 11,29 | ||||
| 2026-02-12 | 13F | Skopos Labs, Inc. | 45.198 | 236,07 | 1.971 | 541,69 | ||||
| 2026-01-21 | 13F | Newbridge Financial Services Group, Inc. | 114 | 5 | ||||||
| 2026-02-10 | 13F | Bank of New York Mellon Corp | 222.701 | 10,43 | 9.723 | 14,92 | ||||
| 2026-04-27 | 13F | Qrg Capital Management, Inc. | 19.124 | 16,22 | 868 | 20,89 | ||||
| 2026-02-13 | 13F | Estabrook Capital Management | 0 | -100,00 | 0 | |||||
| 2026-04-27 | 13F | Truist Financial Corp | 0 | -100,00 | 0 | |||||
| 2026-02-03 | 13F | Ballentine Partners, LLC | 15.695 | -0,30 | 685 | 3,79 | ||||
| 2026-02-10 | 13F | Goldman Sachs Group Inc | 4.384.047 | 69,27 | 191.407 | 76,13 | ||||
| 2026-02-17 | 13F | Fmr Llc | 86.856 | -98,32 | 3.792 | -98,25 | ||||
| 2026-02-19 | 13F | CI Private Wealth, LLC | 49.145 | 3,51 | 2.083 | 4,57 | ||||
| 2026-02-11 | 13F | Jpmorgan Chase & Co | 1.200.732 | -6,30 | 52.424 | -2,51 | ||||
| 2026-02-13 | 13F | Wells Fargo & Company/mn | 88.310 | -6,60 | 3.856 | -2,82 | ||||
| 2026-02-11 | 13F | Jpmorgan Chase & Co | Call | 27.900 | -53,50 | 1.218 | -51,61 | |||
| 2026-02-13 | 13F | Verition Fund Management LLC | 12.398 | 541 | ||||||
| 2026-02-17 | 13F | Toronto Dominion Bank | Call | 62.500 | 2.729 | |||||
| 2026-01-28 | 13F | Geneos Wealth Management Inc. | 136 | 6 | ||||||
| 2026-02-12 | 13F | Jane Street Group, Llc | Put | 81.100 | -39,48 | 3.541 | -37,03 | |||
| 2026-02-12 | 13F | Jane Street Group, Llc | Call | 84.500 | -68,81 | 3.689 | -67,54 | |||
| 2026-02-10 | 13F | Natixis Advisors, L.p. | 0 | -100,00 | 0 | |||||
| 2026-02-06 | 13F | Fairtree Asset Management (Pty) Ltd | 53.704 | 30,32 | 2.345 | 35,57 | ||||
| 2026-02-17 | 13F | Tudor Investment Corp Et Al | Put | 46.500 | 13,41 | 2.030 | 18,02 | |||
| 2026-02-13 | 13F | Verition Fund Management LLC | Put | 128.800 | 0,00 | 5.623 | 4,05 | |||
| 2026-02-13 | 13F | Squarepoint Ops LLC | Put | 20.500 | -29,79 | 895 | -26,94 | |||
| 2026-04-17 | 13F | Brown, Lisle/cummings, Inc. | 149 | 7 | ||||||
| 2026-02-11 | 13F | Buckingham Strategic Partners | 5.331 | -9,98 | 233 | -6,45 | ||||
| 2026-02-13 | 13F | Verition Fund Management LLC | Call | 93.600 | -9,74 | 4.087 | -6,09 | |||
| 2026-02-17 | 13F | Tudor Investment Corp Et Al | Call | 8.500 | -57,29 | 371 | -55,57 | |||
| 2026-02-17 | 13F | Tudor Investment Corp Et Al | 13.970 | -46,14 | 610 | -44,03 | ||||
| 2026-04-27 | 13F | Ethic Inc. | 11.725 | 41,23 | 532 | 46,96 | ||||
| 2026-02-17 | 13F | Jump Financial, LLC | 47.200 | 2.061 | ||||||
| 2026-04-10 | 13F | Abound Wealth Management | 8 | -33,33 | 0 | |||||
| 2026-02-13 | 13F | Squarepoint Ops LLC | Call | 36.000 | 1.572 | |||||
| 2026-02-13 | 13F | Schroder Investment Management Group | 1.814.586 | -18,56 | 80.060 | -13,29 | ||||
| 2025-11-14 | 13F | Credit Agricole S A | 0 | -100,00 | 0 | -100,00 | ||||
| 2026-04-23 | 13F | Lansforsakringar Fondforvaltning AB (publ) | 34.860 | 1.583 | ||||||
| 2026-02-10 | 13F | Envestnet Asset Management Inc | 383.567 | -26,29 | 16.747 | -23,30 | ||||
| 2026-04-17 | 13F | Bell Investment Advisors, Inc | 178 | -36,43 | 8 | -33,33 | ||||
| 2025-11-12 | 13F | NewSquare Capital LLC | 0 | -100,00 | 0 | -100,00 | ||||
| 2026-01-26 | 13F | Mirae Asset Global Investments Co., Ltd. | 18.003 | 1,41 | 786 | 5,65 | ||||
| 2026-04-15 | 13F | DAVENPORT & Co LLC | 5.000 | -1,01 | 227 | 3,18 | ||||
| 2026-01-15 | 13F | Nisa Investment Advisors, Llc | 1.116 | 11,60 | 49 | 17,07 | ||||
| 2026-01-30 | 13F | Us Bancorp \de\ | 20.573 | 16,99 | 898 | 21,85 | ||||
| 2026-02-11 | 13F | Cedar Mountain Advisors, LLC | 500 | 0,00 | 22 | 5,00 | ||||
| 2026-02-13 | 13F | Morgan Stanley | 2.049.360 | 3,45 | 89.475 | 7,64 | ||||
| 2026-02-17 | 13F | Trexquant Investment LP | 0 | -100,00 | 0 | |||||
| 2026-01-28 | 13F | CAPROCK Group, Inc. | 106.936 | 1,01 | 4.669 | 31,72 | ||||
| 2026-02-18 | 13F | Vident Advisory, LLC | 133.119 | 35,44 | 5.812 | 40,91 | ||||
| 2026-02-12 | 13F | Renaissance Technologies Llc | 545.687 | -54,30 | 23.825 | -52,45 | ||||
| 2026-02-11 | 13F | Havemeyer Place LP | 16.643 | 727 | ||||||
| 2026-01-15 | 13F | Allspring Global Investments Holdings, LLC | 1.461.069 | -0,69 | 63.644 | 3,64 | ||||
| 2026-01-20 | 13F | Stratos Wealth Partners, LTD. | 5.813 | -84,97 | 254 | -84,40 | ||||
| 2026-02-17 | 13F | Point72 Asset Management, L.P. | Call | 168.300 | 7.348 | |||||
| 2025-11-14 | 13F | Graham Capital Management, L.P. | 0 | -100,00 | 0 | |||||
| 2026-02-17 | 13F | Citadel Advisors Llc | Put | 349.000 | -28,95 | 15.237 | -26,07 | |||
| 2026-04-20 | 13F | Ritholtz Wealth Management | 78.244 | 28,89 | 3.552 | 34,04 | ||||
| 2026-04-21 | 13F | PDS Planning, Inc | 0 | -100,00 | 0 | |||||
| 2026-02-13 | 13F | Arrowstreet Capital, Limited Partnership | 5.011.733 | 0,00 | 218.812 | 4,05 | ||||
| 2026-02-17 | 13F | Citadel Advisors Llc | 37.648 | 1.644 | ||||||
| 2026-02-17 | 13F | Citadel Advisors Llc | Call | 541.800 | 5,08 | 23.655 | 9,34 | |||
| 2026-04-20 | 13F | Ronald Blue Trust, Inc. | 4.957 | 4,53 | 225 | 8,70 | ||||
| 2026-02-11 | 13F | West Family Investments, Inc. | 5.260 | 0,00 | 230 | 4,09 | ||||
| 2026-02-12 | 13F | Principal Securities, Inc. | 23.438 | -31,29 | 1.023 | -28,51 | ||||
| 2026-01-22 | 13F | Personal Cfo Solutions, Llc | 11.057 | 4,94 | 483 | 9,05 | ||||
| 2026-02-17 | 13F | Advisory Services Network, LLC | 0 | -100,00 | 0 | |||||
| 2026-02-11 | 13F | Fox Run Management, L.l.c. | 11.585 | 506 | ||||||
| 2026-02-13 | 13F | SRS Capital Advisors, Inc. | 1.136 | 352,59 | 50 | 390,00 | ||||
| 2026-02-17 | 13F | Northern Trust Corp | 434.759 | 2,30 | 18.982 | 6,45 | ||||
| 2026-02-10 | 13F | Bnp Paribas Arbitrage, Sa | 115.464 | 62,84 | 5.041 | 69,45 | ||||
| 2026-02-12 | 13F | Quadrant Capital Group Llc | 8.995 | 1,42 | 393 | 5,38 | ||||
| 2026-01-28 | 13F | Hoey Investments, Inc | 3.350 | 0,00 | 146 | 4,29 | ||||
| 2026-02-04 | 13F | Paradigm Asset Management Co Llc | 6.118 | 0,00 | 267 | 4,30 | ||||
| 2026-04-06 | 13F | GAMMA Investing LLC | 7.242 | -3,96 | 329 | -0,30 | ||||
| 2026-02-10 | 13F | Savant Capital, LLC | 11.963 | 6,18 | 522 | 10,59 | ||||
| 2026-02-05 | 13F | Cambridge Investment Research Advisors, Inc. | 47.626 | 115,50 | 2 | |||||
| 2026-04-21 | 13F | Pinnacle Associates Ltd | 7.578 | -2,29 | 344 | 1,78 | ||||
| 2026-02-09 | 13F | Todd Asset Management Llc | 113.185 | 4.942 | ||||||
| 2026-02-17 | 13F | Bayesian Capital Management, LP | 0 | -100,00 | 0 | |||||
| 2026-02-24 | 13F | DGS Capital Management, LLC | 18.271 | 10,19 | 798 | 14,68 | ||||
| 2026-02-17 | 13F | Aqr Capital Management Llc | 1.791.823 | 210,99 | 78.231 | 224,20 | ||||
| 2026-04-06 | 13F | Highline Wealth Partners Llc | 382 | 2,41 | 17 | 6,25 | ||||
| 2026-04-20 | 13F | Yorktown Management & Research Co Inc | 22.750 | 0,00 | 1.033 | 3,93 | ||||
| 2025-11-14 | 13F | Jane Street Group, Llc | 0 | -100,00 | 0 | -100,00 | ||||
| 2026-02-13 | 13F | Brown Advisory Inc | 7.093 | 310 | ||||||
| 2026-02-06 | 13F | Csenge Advisory Group | 0 | -100,00 | 0 | |||||
| 2026-02-17 | 13F | Clark Capital Management Group, Inc. | 1.194.172 | -48,03 | 52.138 | -45,93 | ||||
| 2026-02-04 | 13F | Beverly Hills Private Wealth, LLC | 7.151 | 0,00 | 300 | 0,00 | ||||
| 2026-04-21 | 13F | Robeco Institutional Asset Management B.V. | 6.317.364 | 3,81 | 286.808 | 7,94 | ||||
| 2026-02-13 | 13F | Toroso Investments, LLC | 11.554 | 22,63 | 504 | 27,59 | ||||
| 2026-04-17 | 13F | AdvisorNet Financial, Inc | 2.300 | -8,00 | 104 | -4,59 | ||||
| 2026-04-24 | 13F | Yousif Capital Management, Llc | 10.607 | 0,00 | 482 | -14,26 | ||||
| 2026-02-02 | 13F | Horizon Investments, LLC | 2.482 | 108 | ||||||
| 2026-02-17 | 13F | Clear Street Markets Llc | 5.200 | -45,26 | 227 | -42,96 | ||||
| 2026-02-11 | 13F | Fca Corp /tx | 8.200 | 0,00 | 358 | 4,07 | ||||
| 2026-02-17 | 13F | Edmond De Rothschild Holding S.a. | 109.873 | -9,16 | 4.797 | -5,48 | ||||
| 2026-02-06 | 13F | GPS Wealth Strategies Group, LLC | 0 | -100,00 | 0 | |||||
| 2026-02-12 | 13F | BRYN MAWR TRUST Co | 0 | -100,00 | 0 | -100,00 | ||||
| 2026-02-13 | 13F/A | Virtus ETF Advisers LLC | 0 | -100,00 | 0 | |||||
| 2026-02-10 | 13F | Peapack Gladstone Financial Corp | 11.781 | -6,86 | 1 | |||||
| 2026-01-28 | 13F | B. Metzler seel. Sohn & Co. AG | 80.111 | 5,81 | 3.500 | 10,17 | ||||
| 2026-02-17 | 13F | Man Group plc | 3.650.799 | 63,74 | 159.394 | 70,37 | ||||
| 2026-01-15 | 13F | Range Financial Group LLC | 87.322 | -0,21 | 3.812 | 3,84 | ||||
| 2026-02-12 | 13F | New York State Common Retirement Fund | 11.988 | 523 | ||||||
| 2026-02-17 | 13F | Creative Planning | 134.309 | 10,28 | 5.864 | 14,74 | ||||
| 2026-01-28 | 13F | U S Global Investors Inc | 150.000 | -45,78 | 6.549 | -43,58 | ||||
| 2026-04-24 | 13F | Oakworth Capital, Inc. | 300 | 0,00 | 14 | 0,00 | ||||
| 2026-02-17 | 13F | Two Sigma Investments, Lp | 103.091 | -24,19 | 4.501 | -21,14 | ||||
| 2026-01-23 | 13F | Optima Capital Llc | 116 | 5 | ||||||
| 2026-01-29 | 13F | D.a. Davidson & Co. | 21.669 | 0,04 | 946 | 4,19 | ||||
| 2026-02-11 | 13F | Parallel Advisors, LLC | 7.220 | -3,11 | 315 | 0,96 | ||||
| 2026-02-17 | 13F | Jones Financial Companies Lllp | 4.150 | 15,21 | 181 | 23,13 | ||||
| 2026-04-10 | 13F | Country Trust Bank | 1.100 | 0,00 | 50 | 2,08 | ||||
| 2026-02-12 | 13F | Stelac Advisory Services LLC | 2.800 | 0,00 | 122 | 4,27 | ||||
| 2026-04-16 | 13F | Roble, Belko & Company, Inc | 0 | -100,00 | 0 | |||||
| 2026-04-22 | 13F | Janney Montgomery Scott LLC | 266.266 | -27,72 | 12 | -25,00 | ||||
| 2025-11-14 | 13F | Jain Global LLC | 0 | -100,00 | 0 | -100,00 | ||||
| 2026-02-12 | 13F | BlackRock, Inc. | 13.600.232 | 21,35 | 593.786 | 26,26 | ||||
| 2026-04-16 | 13F | SG Americas Securities, LLC | 104.515 | 503,12 | 5 | |||||
| 2026-01-29 | 13F | Ashton Thomas Private Wealth, LLC | 10.208 | -93,28 | 446 | -93,01 | ||||
| 2026-02-11 | 13F | Metis Global Partners, LLC | 68.585 | -8,81 | 2.994 | -5,10 | ||||
| 2026-02-13 | 13F | Towarzystwo Funduszy Inwestycyjnych Pzu Sa | 0 | -100,00 | 0 | |||||
| 2026-02-12 | 13F | Cibc World Markets Corp | Call | 0 | -100,00 | 0 | ||||
| 2026-02-18 | 13F | Mackenzie Financial Corp | 1.462.427 | 37,74 | 64.395 | 44,55 | ||||
| 2026-02-17 | 13F | Guggenheim Capital Llc | 320.987 | -9,34 | 14.014 | -5,66 | ||||
| 2026-04-27 | 13F | Sierra Summit Advisors Llc | 20.350 | 4,79 | 924 | 8,97 | ||||
| 2026-02-17 | 13F | D. E. Shaw & Co., Inc. | Call | 110.000 | 4.803 | |||||
| 2026-04-10 | 13F | Novem Group | 28.739 | 1,33 | 1.305 | 5,33 | ||||
| 2026-02-12 | 13F | Northwest & Ethical Investments L.P. | 15.150 | -34,16 | 668 | -29,91 | ||||
| 2026-02-17 | 13F | Amundi | 2.899.084 | -4,31 | 126.574 | -1,63 | ||||
| 2026-02-11 | 13F | Comprehensive Financial Planning, Inc./PA | 0 | -100,00 | 0 | |||||
| 2026-02-09 | 13F | Employees Retirement System of Texas | 45.333 | 2 | ||||||
| 2026-02-05 | 13F | Gabelli Funds Llc | 392.100 | 4,84 | 17.119 | 9,09 | ||||
| 2026-02-13 | 13F | Atlas Capital Advisors Llc | 2.790 | 33,49 | 122 | 146,94 | ||||
| 2026-02-13 | 13F | Citigroup Inc | 96.809 | -12,65 | 4.227 | -9,12 | ||||
| 2026-02-17 | 13F | Signature Equity Partners, LLC | 237 | 10 | ||||||
| 2026-02-12 | 13F | Rossby Financial, LCC | 86 | -41,50 | 4 | -50,00 | ||||
| 2026-02-13 | 13F | Sumitomo Life Insurance Co | 59.110 | 2.582 | ||||||
| 2026-01-14 | 13F | Net Worth Advisory Group | 0 | -100,00 | 0 | |||||
| 2026-02-17 | 13F | D. E. Shaw & Co., Inc. | 111.404 | -40,80 | 4.864 | -38,40 | ||||
| 2026-01-08 | 13F | Tuttle Tactical Management LLC | 5.463 | 239 | ||||||
| 2026-03-06 | 13F | Hsbc Holdings Plc | Call | 0 | -100,00 | 0 | ||||
| 2026-02-17 | 13F | Royal Bank Of Canada | Put | 0 | -100,00 | 0 | ||||
| 2026-02-12 | 13F | Bank Of Montreal /can/ | 145.558 | -10,20 | 6.355 | -6,56 | ||||
| 2025-11-12 | 13F | Headlands Technologies LLC | 0 | -100,00 | 0 | |||||
| 2026-02-13 | 13F | Mml Investors Services, Llc | 51.236 | -9,20 | 2.237 | -5,53 | ||||
| 2026-02-23 | 13F | Walser Wealth Management Company, A Ltd Liability Co | 19.100 | 834 | ||||||
| 2025-11-14 | 13F | Point72 Asia (Singapore) Pte. Ltd. | 0 | -100,00 | 0 | |||||
| 2026-02-05 | 13F | Atria Investments Llc | 19.022 | -5,70 | 831 | -1,89 | ||||
| 2026-04-07 | 13F | GK Wealth Management LLC | 0 | -100,00 | 0 | |||||
| 2026-02-17 | 13F | Grantham, Mayo, Van Otterloo & Co. LLC | 36.300 | -43,72 | 1.585 | -41,46 | ||||
| 2025-11-14 | 13F | Squarepoint Ops LLC | 0 | -100,00 | 0 | -100,00 | ||||
| 2025-11-06 | 13F | Ameritas Advisory Services, LLC | 0 | -100,00 | 0 | -100,00 | ||||
| 2025-11-14 | 13F | CoreCommodity Management, LLC | 0 | -100,00 | 0 | |||||
| 2026-02-06 | 13F | Abn Amro Investment Solutions | 41.629 | 23,45 | 1.818 | 28,50 | ||||
| 2026-02-17 | 13F | Royal Bank Of Canada | Call | 0 | -100,00 | 0 | ||||
| 2026-04-24 | 13F | Ninety One UK Ltd | 98 | -39,51 | 4 | -42,86 | ||||
| 2026-02-13 | 13F | Global Strategic Management Inc | Call | 0 | -100,00 | 0 | ||||
| 2026-04-15 | 13F | Generali Investments CEE, investicni spolecnost, a.s. | 147.554 | -2,96 | 6.699 | 0,90 | ||||
| 2026-02-17 | 13F | Laird Norton Trust Company, Llc | 55.286 | 2.414 | ||||||
| 2026-02-13 | 13F | FORA Capital, LLC | 0 | -100,00 | 0 | |||||
| 2026-02-14 | 13F | Rockefeller Capital Management L.P. | 2.096 | 1.604,07 | 92 | 1.720,00 | ||||
| 2026-04-22 | 13F | Larry Mathis Financial Planning, LLC | 5.533 | -1,58 | 251 | 2,45 | ||||
| 2026-01-29 | 13F | Teachers Retirement System Of The State Of Kentucky | 112.400 | 5 | ||||||
| 2026-02-17 | 13F | Silvercrest Asset Management Group Llc | 155.682 | -45,53 | 6.797 | -43,33 | ||||
| 2026-02-12 | 13F | Campbell & CO Investment Adviser LLC | 11.960 | 522 | ||||||
| 2026-02-12 | 13F | Integrated Quantitative Investments LLC | 68.232 | 8,24 | 2.979 | 12,63 | ||||
| 2026-02-13 | 13F | Boston Partners | 190.631 | 8.323 | ||||||
| 2026-02-12 | 13F | Ci Investments Inc. | 217.228 | -5,12 | 9.484 | 105.277,78 | ||||
| 2026-02-09 | 13F | Cary Street Partner Investment Advisory Llc | 1.093 | 2,53 | 48 | 6,82 | ||||
| 2026-02-17 | 13F | Concentric Capital Strategies, LP | 0 | -100,00 | 0 | |||||
| 2026-04-01 | 13F | Confluence Investment Management Llc | 14.856 | -3,31 | 674 | 0,60 | ||||
| 2025-11-14 | 13F | Eqis Capital Management, Inc. | 0 | -100,00 | 0 | |||||
| 2026-02-12 | 13F | Alps Advisors Inc | 209.300 | -19,39 | 9.138 | -16,13 | ||||
| 2026-02-10 | 13F | Elgethun Capital Management | 5.000 | 0,00 | 218 | 3,32 | ||||
| 2026-02-06 | 13F | Pnc Financial Services Group, Inc. | 12.517 | 13,65 | 546 | 18,18 | ||||
| 2026-02-13 | 13F | Ieq Capital, Llc | 15.133 | -0,17 | 661 | 3,77 | ||||
| 2026-02-12 | 13F | Groupe la Francaise | 410.000 | 12,33 | 17.891 | 16,71 | ||||
| 2026-02-12 | 13F | Xponance, Inc. | 4.781 | 209 | ||||||
| 2026-02-17 | 13F | Capital Fund Management S.a. | Put | 86.100 | -17,21 | 3.759 | -13,84 | |||
| 2026-02-17 | 13F | Capital Fund Management S.a. | Call | 131.000 | 17,59 | 5.719 | 22,36 | |||
| 2025-11-14 | 13F | Moore Capital Management, Lp | 0 | -100,00 | 0 | |||||
| 2026-02-17 | 13F | Mercer Global Advisors Inc /adv | 7.751 | 3,60 | 338 | 7,99 | ||||
| 2026-04-27 | 13F | Greenleaf Trust | 0 | -100,00 | 0 | |||||
| 2026-02-17 | 13F | Wiley Bros.-aintree Capital, Llc | 28.449 | 20,63 | 1.243 | 25,30 | ||||
| 2025-11-12 | 13F | Catalyst Funds Management Pty Ltd | 0 | -100,00 | 0 | |||||
| 2026-02-03 | 13F | Primoris Wealth Advisors, Llc | 17.507 | -5,40 | 764 | -1,55 | ||||
| 2026-02-13 | 13F | Sei Investments Co | 281.826 | 72,99 | 12.305 | 79,99 | ||||
| 2026-02-05 | 13F | Bessemer Group Inc | 143 | 0 | ||||||
| 2026-02-12 | 13F | Brinker Capital Investments, LLC | 0 | -100,00 | 0 | |||||
| 2026-04-09 | 13F | Towarzystwo Funduszy Inwestycyjnych Allianz Polska S.A. | 67.000 | 35,90 | 3.042 | 39,82 | ||||
| 2026-02-13 | 13F | National Bank Of Canada /fi/ | 296.588 | -70,38 | 12.944 | -69,20 | ||||
| 2026-02-17 | 13F | Cape Investment Advisory, Inc. | 72 | 3 | ||||||
| 2026-02-13 | 13F | Aire Advisors, Llc | 0 | -100,00 | 0 | |||||
| 2026-02-17 | 13F | Russell Investments Group, Ltd. | 1.174.887 | 62,83 | 51.442 | 69,92 | ||||
| 2026-02-12 | 13F | Barometer Capital Management Inc. | 0 | -100,00 | 0 | |||||
| 2026-01-06 | 13F | E Six Thirteen, Llc | 32.499 | -6,63 | 1.419 | -2,88 | ||||
| 2026-01-22 | 13F | Richardson Financial Services Inc. | 1.313 | -33,95 | 57 | -31,33 | ||||
| 2026-02-10 | 13F | AdvisorShares Investments LLC | 42.678 | -5,21 | 1.863 | -1,38 | ||||
| 2026-02-11 | 13F | Franklin Resources Inc | 33.144 | -3,75 | 1.447 | 0,21 | ||||
| 2025-11-14 | 13F | AXA Investment Managers S.A. | 29.364 | 1.232 | ||||||
| 2026-02-09 | 13F | Themes Management Co LLC | 28.933 | 1.263 | ||||||
| 2026-04-24 | 13F | UMA Financial Services, Inc. | 15 | -54,55 | 1 | -100,00 | ||||
| 2026-02-17 | 13F | Royal Bank Of Canada | 1.035.660 | 4,51 | 45.217 | 8,74 | ||||
| 2026-04-17 | 13F | Outlook Wealth Advisors, LLC | 10.707 | -1,16 | 486 | 2,97 | ||||
| 2026-02-18 | 13F | GWM Advisors LLC | 0 | -100,00 | 0 | |||||
| 2026-02-10 | 13F | Acadian Asset Management Llc | 2.123.425 | 13.131,71 | 93 | |||||
| 2026-04-15 | 13F | Bayforest Capital Ltd | 0 | -100,00 | 0 | |||||
| 2026-02-13 | 13F | S&t Bank/pa | 200 | 9 | ||||||
| 2026-02-17 | 13F | Point72 Asset Management, L.P. | 0 | -100,00 | 0 | -100,00 | ||||
| 2026-02-17 | 13F | Parvin Asset Management, LLC | 1.275 | 56 | ||||||
| 2026-02-11 | 13F | Allianz Asset Management GmbH | 630.948 | 0,00 | 27.547 | 4,05 | ||||
| 2026-02-17 | 13F | Capital Fund Management S.a. | 56.986 | 2.488 | ||||||
| 2025-11-14 | 13F | Brevan Howard Capital Management LP | 0 | -100,00 | 0 | |||||
| 2025-11-21 | 13F/A | CIBC Bancorp USA Inc. | Call | 42.000 | 1.762 | |||||
| 2026-02-10 | 13F | Quantbot Technologies LP | 21.317 | 931 | ||||||
| 2026-02-17 | 13F | Toronto Dominion Bank | 250.000 | 0,00 | 10.905 | 5,23 | ||||
| 2026-02-13 | 13F | Vontobel Holding Ltd. | 443.123 | -37,60 | 19.347 | -35,07 | ||||
| 2026-02-17 | 13F | Advisor Group Holdings, Inc. | 76.876 | -69,40 | 3.357 | -66,22 | ||||
| 2026-02-17 | 13F | Private Advisor Group, LLC | 0 | -100,00 | 0 | |||||
| 2026-01-29 | 13F | Rakuten Securities, Inc. | 3.983 | -35,68 | 174 | -33,20 | ||||
| 2026-04-21 | 13F | Aaron Wealth Advisors LLC | 7.912 | 43,20 | 359 | 48,96 | ||||
| 2026-02-17 | 13F | Aquatic Capital Management LLC | 114.264 | 34,71 | 4.989 | 40,15 | ||||
| 2026-04-24 | 13F | USS Investment Management Ltd | 1.200.151 | -33,36 | 54.493 | -30,67 | ||||
| 2026-04-24 | 13F | Profund Advisors Llc | 115.934 | 2,58 | 5.263 | 6,67 | ||||
| 2026-02-03 | 13F | SBI Securities Co., Ltd. | 67.740 | -43,70 | 2.958 | -41,42 | ||||
| 2026-02-13 | 13F | Pinnacle Wealth Planning Services, Inc. | 854 | 37 | ||||||
| 2026-02-13 | 13F | Integrated Wealth Concepts LLC | 100.270 | -16,34 | 4.378 | -12,95 | ||||
| 2026-02-13 | 13F | BNP Paribas Asset Management Holding S.A. | 54.369 | 2 | ||||||
| 2025-11-14 | 13F | Cubist Systematic Strategies, LLC | 0 | -100,00 | 0 | -100,00 | ||||
| 2026-02-13 | 13F | Segall Bryant & Hamill, Llc | 19.300 | 38,85 | 843 | 44,43 | ||||
| 2026-01-23 | 13F | Assetmark, Inc | 4.941 | 27,54 | 216 | 32,72 | ||||
| 2026-04-21 | 13F | Old National Bancorp /in/ | 4.885 | -1,01 | 222 | 2,79 | ||||
| 2026-02-02 | 13F | Fifth Third Bancorp | 34 | 70,00 | 1 | |||||
| 2026-02-17 | 13F | Bank Of America Corp /de/ | 584.036 | 129,55 | 25.499 | 138,87 | ||||
| 2026-04-20 | 13F | Sowell Financial Services LLC | 6.499 | 6,98 | 295 | 11,32 | ||||
| 2025-11-14 | 13F | D. E. Shaw & Co., Inc. | Put | 0 | -100,00 | 0 | -100,00 | |||
| 2026-02-17 | 13F | SummitTX Capital, L.P. | 0 | -100,00 | 0 | |||||
| 2026-02-17 | 13F | Cetera Investment Advisers | 91.002 | -27,19 | 3.973 | -24,24 | ||||
| 2026-02-09 | 13F | Beck Bode, LLC | Call | 0 | -100,00 | 0 | ||||
| 2026-01-28 | 13F | Arizona State Retirement System | 0 | -100,00 | 0 | |||||
| 2026-04-08 | 13F | E Fund Management (Hong Kong) Co., Ltd. | 32.769 | 1.488 | ||||||
| 2026-02-17 | 13F | Fwl Investment Management, Llc | 297 | 13 | ||||||
| 2026-04-24 | 13F | Vision Financial Markets Llc | 75 | 0,00 | 3 | 0,00 | ||||
| 2026-02-13 | 13F | Transamerica Financial Advisors, Inc. | 3.852 | -41,61 | 168 | -39,13 | ||||
| 2025-12-16 | 13F | Garde Capital, Inc. | 0 | -100,00 | 0 | |||||
| 2026-02-13 | 13F | State Street Corp | 1.018.830 | -3,48 | 44.540 | 0,41 | ||||
| 2026-02-13 | 13F | Bridgewater Associates, LP | 977.019 | 155,80 | 42.657 | 166,17 | ||||
| 2026-02-18 | 13F | Cim, Llc | 59.801 | 2.611 | ||||||
| 2026-02-03 | 13F | Diversify Wealth Management, Llc | 58.183 | 8,42 | 2.883 | 41,34 | ||||
| 2026-01-16 | 13F | FNY Investment Advisers, LLC | 0 | -100,00 | 0 | |||||
| 2026-04-27 | 13F | V-Square Quantitative Management LLC | 544 | 25 | ||||||
| 2026-02-27 | 13F | Strategic Investment Solutions, Inc. /IL | 200 | 0,00 | 9 | 0,00 | ||||
| 2026-02-12 | 13F | Qtron Investments LLC | 0 | -100,00 | 0 | |||||
| 2026-04-21 | 13F | SmartHarvest Portfolios, LLC | 4.868 | 5,94 | 221 | 10,50 | ||||
| 2025-11-14 | 13F | Parallax Volatility Advisers, L.P. | 0 | -100,00 | 0 | -100,00 | ||||
| 2026-04-20 | 13F | CWA Asset Management Group, LLC | 4.498 | -23,72 | 204 | -20,62 | ||||
| 2026-02-10 | 13F | Connor, Clark & Lunn Investment Management Ltd. | 1.246.117 | 41,86 | 54.405 | 47,61 | ||||
| 2026-02-11 | 13F | MCF Advisors LLC | 200 | 0,00 | 9 | 0,00 | ||||
| 2026-02-13 | 13F | Umb Bank N A/mo | 423 | 0,00 | 18 | 5,88 | ||||
| 2026-02-10 | 13F | South Street Advisors LLC | 653.232 | -7,74 | 28.520 | -4,00 | ||||
| 2026-02-10 | 13F | Catalyst Capital Advisors LLC | 4.480 | 196 | ||||||
| 2025-11-14 | 13F | Mount Yale Investment Advisors, LLC | 0 | -100,00 | 0 | -100,00 | ||||
| 2026-01-27 | 13F | WealthCollab, LLC | 701 | 0,00 | 31 | 3,45 | ||||
| 2026-02-13 | 13F | Merk Investments LLC | 0 | -100,00 | 0 | |||||
| 2025-11-14 | 13F | Strategic Wealth Partners, Ltd. | 345 | 14 | ||||||
| 2026-02-02 | 13F | Advisors Preferred, LLC | 2.502 | -76,73 | 109 | -75,89 | ||||
| 2025-11-14 | 13F | Point72 (DIFC) Ltd | 0 | -100,00 | 0 | |||||
| 2026-02-10 | 13F | Eurizon Capital SGR S.p.A. | 56.571 | 2.487 | ||||||
| 2025-11-13 | 13F | Total Investment Management Inc | 0 | -100,00 | 0 | |||||
| 2025-11-14 | 13F | Quantessence Capital LLC | 0 | -100,00 | 0 | |||||
| 2026-02-02 | 13F | Cornerstone Planning Group LLC | 207 | 0,00 | 13 | 50,00 | ||||
| 2026-02-05 | 13F | Allworth Financial LP | 2.245 | 1,49 | 98 | 6,52 | ||||
| 2025-11-14 | 13F | Point72 Hong Kong Ltd | 0 | -100,00 | 0 | -100,00 | ||||
| 2026-02-11 | 13F | Ramirez Asset Management, Inc. | 57.503 | 2.511 | ||||||
| 2026-02-17 | 13F | Millennium Management Llc | Call | 20.200 | 42,25 | 882 | 48,07 | |||
| 2026-04-27 | 13F | Revisor Wealth Management LLC | 4.872 | 8,92 | 221 | 3,27 | ||||
| 2026-04-27 | 13F | Rwc Asset Advisors (us) Llc | 1.064.393 | -38,51 | 48.323 | -36,06 | ||||
| 2026-02-03 | 13F | Sequoia Financial Advisors, LLC | 24.830 | 1,46 | 1.084 | 5,65 | ||||
| 2026-02-10 | 13F | Nomura Asset Management Co Ltd | 0 | 0 | ||||||
| 2026-02-11 | 13F | Group One Trading, L.p. | Put | 136.700 | -10,83 | 5.968 | -7,21 | |||
| 2026-02-11 | 13F | Group One Trading, L.p. | Call | 478.700 | 25,61 | 20.900 | 30,71 | |||
| 2026-02-11 | 13F | O'shaughnessy Asset Management, Llc | 198.662 | 19,50 | 8.674 | 24,34 | ||||
| 2026-02-17 | 13F | Millennium Management Llc | Put | 4.800 | 0,00 | 210 | 3,98 | |||
| 2026-02-17 | 13F | Millennium Management Llc | 471.025 | 613,24 | 20.565 | 642,11 | ||||
| 2026-04-27 | 13F | Y-Intercept (Hong Kong) Ltd | 154.397 | 7.010 | ||||||
| 2026-02-12 | 13F | Dimensional Fund Advisors Lp | 4.980.882 | -10,70 | 217.434 | -7,08 | ||||
| 2026-02-17 | 13F | Alliancebernstein L.p. | 545.265 | 227,35 | 23.806 | 240,62 | ||||
| 2026-04-27 | 13F | Oxbow Advisors, LLC | 38.675 | 0,00 | 1.756 | 3,97 | ||||
| 2026-02-12 | 13F | CIBC Private Wealth Group, LLC | 1.031 | 20,87 | 45 | 28,57 | ||||
| 2026-02-17 | 13F | Susquehanna International Group, Llp | Put | 356.400 | -28,26 | 15.560 | -25,35 | |||
| 2026-02-17 | 13F | Susquehanna International Group, Llp | Call | 980.700 | 12,23 | 42.817 | 16,78 | |||
| 2026-01-29 | 13F | Sanctuary Advisors, LLC | 8.573 | -0,45 | 374 | 3,60 | ||||
| 2026-01-23 | 13F | Lester Murray Antman dba SimplyRich | 17.305 | 0,05 | 1 | |||||
| 2026-02-17 | 13F | Susquehanna International Group, Llp | 6.945 | -68,77 | 303 | -67,52 | ||||
| 2025-11-14 | 13F | Parallax Volatility Advisers, L.P. | Put | 0 | -100,00 | 0 | -100,00 | |||
| 2026-02-06 | 13F | Resolute Wealth Strategies, LLC | 21.707 | -2,25 | 948 | 1,72 | ||||
| 2026-02-12 | 13F | Federated Hermes, Inc. | 19.802 | 0,19 | 865 | 4,22 | ||||
| 2026-02-09 | 13F | Cary Street Partners Financial Llc | 4.700 | 0,00 | 205 | 4,06 | ||||
| 2026-02-17 | 13F | Two Sigma Advisers, Lp | 145.900 | -6,11 | 6.370 | -2,32 | ||||
| 2026-02-20 | 13F | Dorsey Wright & Associates | 68.136 | 3,66 | 2.975 | 7,87 | ||||
| 2026-01-27 | 13F | TD Waterhouse Canada Inc. | 1.640 | -98,77 | 72 | -98,59 | ||||
| 2026-01-22 | 13F | Massachusetts Financial Services Co /ma/ | 2.527.832 | -18,12 | 110.365 | -14,81 | ||||
| 2026-02-13 | 13F | Walleye Capital LLC | 21.761 | 300,83 | 950 | 318,50 | ||||
| 2026-02-17 | 13F | Quantinno Capital Management LP | 70.052 | 16,41 | 3.058 | 21,11 | ||||
| 2026-02-13 | 13F | Mariner, LLC | 31.365 | 2,93 | 1.371 | 7,20 | ||||
| 2026-02-13 | 13F | Kestra Advisory Services, LLC | 3.459 | 151 | ||||||
| 2026-02-17 | 13F | MIRAE ASSET GLOBAL ETFS HOLDINGS Ltd. | 972.232 | -6,16 | 42.448 | -2,36 | ||||
| 2026-04-27 | 13F | Sound Income Strategies, LLC | 150 | 0,00 | 7 | 0,00 | ||||
| 2026-02-13 | 13F | Walleye Capital LLC | Call | 149.300 | 8.682,35 | 6.518 | 9.080,28 | |||
| 2026-02-13 | 13F | Walleye Capital LLC | Put | 105.600 | 164,00 | 4.610 | 174,73 | |||
| 2026-02-17 | 13F | Public Employees Retirement System Of Ohio | 198.491 | 96,31 | 8.666 | 104,29 | ||||
| 2026-02-13 | 13F | Smartleaf Asset Management LLC | 3.497 | 24,23 | 154 | 32,76 | ||||
| 2026-02-09 | 13F | IPG Investment Advisors LLC | 6.100 | 0,00 | 266 | 4,31 | ||||
| 2026-02-13 | 13F | Victory Capital Management Inc | 2.139.741 | 0,00 | 93.421 | 4,05 | ||||
| 2026-02-17 | 13F | Weiss Asset Management LP | 10.620 | 464 | ||||||
| 2026-04-27 | 13F | Leonteq Securities AG | 7.472 | -63,49 | 339 | -62,04 | ||||
| 2026-01-23 | 13F | Bingham Private Wealth, Llc | 4.581 | 200 | ||||||
| 2025-11-14 | 13F | Walleye Trading LLC | 0 | -100,00 | 0 | -100,00 | ||||
| 2026-02-12 | 13F | Federation des caisses Desjardins du Quebec | 387 | 176,43 | 17 | 220,00 | ||||
| 2026-02-10 | 13F | Td Asset Management Inc | 228.257 | -18,89 | 9.966 | -15,60 | ||||
| 2026-01-22 | 13F | Bartlett & Co. Wealth Management Llc | 4.000 | 0,00 | 175 | 4,19 | ||||
| 2026-01-21 | 13F/A | Euro Pacific Asset Management, LLC | 13.667 | 0,12 | 1 | |||||
| 2026-04-07 | 13F | Carolina Wealth Advisors, LLC | 53.861 | 134.552,50 | 2.445 | 244.400,00 | ||||
| 2026-02-09 | 13F | Huntington National Bank | 216 | 9 | ||||||
| 2025-11-04 | 13F | High Note Wealth, LLC | 0 | -100,00 | 0 | |||||
| 2026-04-27 | 13F | RWC Asset Management LLP | 1.332.371 | -0,27 | 60.490 | 3,70 | ||||
| 2026-02-04 | 13F | Twin Lakes Capital Management, LLC | 4.323 | 0,00 | 189 | 3,87 | ||||
| 2026-01-07 | 13F | Harbour Capital Advisors, LLC | 50.525 | 0,53 | 2.201 | 4,61 | ||||
| 2026-02-17 | 13F | XTX Topco Ltd | 93.071 | 4.063 | ||||||
| 2026-02-11 | 13F | Deutsche Bank Ag\ | 5.989.063 | -6,27 | 261.482 | -2,47 | ||||
| 2026-02-13 | 13F | Pathstone Holdings, LLC | 19.649 | 0,09 | 858 | 4,13 | ||||
| 2026-02-17 | 13F | Perritt Capital Management Inc | 0 | -100,00 | 0 | -100,00 | ||||
| 2026-02-05 | 13F | Gamco Investors, Inc. Et Al | 55.520 | 0,58 | 2.424 | 4,66 | ||||
| 2026-02-13 | 13F | Centiva Capital, LP | 0 | -100,00 | 0 | |||||
| 2026-04-17 | 13F | PKO Investment Management Joint-Stock Co | 304.961 | -4,55 | 13.845 | -0,75 | ||||
| 2026-01-23 | 13F | Bridgewater Advisors Inc. | 20.861 | 0,82 | 1.070 | 37,00 | ||||
| 2026-02-17 | 13F | Tower Research Capital LLC (TRC) | 27 | 58,82 | 1 | |||||
| 2026-04-07 | 13F | Signaturefd, Llc | 12.608 | -0,80 | 572 | 3,25 | ||||
| 2026-02-17 | 13F | Blair William & Co/il | 10.545 | 97,66 | 460 | 106,28 | ||||
| 2026-02-10 | 13F | Bnp Paribas | 398 | 0,00 | 17 | 6,25 | ||||
| 2026-01-28 | 13F | DekaBank Deutsche Girozentrale | 121.770 | 0,00 | 2 | -60,00 | ||||
| 2025-11-07 | 13F | Sierra Ocean, Llc | 0 | -100,00 | 0 | |||||
| 2026-02-13 | 13F | Panagora Asset Management Inc | 27.714 | -1,18 | 1.210 | 2,81 | ||||
| 2026-02-11 | 13F | Twin Tree Management, LP | Put | 108.600 | 422,12 | 4.741 | 443,69 | |||
| 2026-02-11 | 13F | Twin Tree Management, LP | 90.288 | -72,28 | 3.942 | -71,16 | ||||
| 2026-04-20 | 13F | Up Capital Management, Inc. | 0 | -100,00 | 0 | |||||
| 2026-01-21 | 13F | Flagship Harbor Advisors, Llc | 2.550 | 111 | ||||||
| 2026-02-11 | 13F | Twin Tree Management, LP | Call | 338.600 | 5,19 | 14.783 | 9,46 | |||
| 2026-02-13 | 13F | Gen-Wealth Partners Inc | 650 | -18,75 | 28 | -15,15 | ||||
| 2026-02-17 | 13F | Ameriprise Financial Inc | 24.967 | 2,09 | 1.090 | 6,24 | ||||
| 2026-02-13 | 13F | Manufacturers Life Insurance Company, The | 0 | -100,00 | 0 | |||||
| 2026-02-13 | 13F | Rhumbline Advisers | 6.472 | -10,47 | 283 | -6,93 | ||||
| 2025-11-06 | 13F | Financial Advocates Investment Management | 0 | -100,00 | 0 | |||||
| 2026-02-04 | 13F | Abc Arbitrage Sa | 0 | -100,00 | 0 | |||||
| 2026-01-30 | 13F | Archer Investment Corp | 0 | -100,00 | 0 | |||||
| 2026-02-10 | 13F | CIBC World Markets Inc. | 0 | -100,00 | 0 | |||||
| 2026-02-11 | 13F | Erste Asset Management GmbH | 30.300 | 1.321 | ||||||
| 2026-04-15 | 13F | Exchange Traded Concepts, Llc | 3.759 | 52,19 | 171 | 58,88 | ||||
| 2026-01-29 | 13F | IMC-Chicago, LLC | Put | 49.000 | 58,06 | 2.139 | 64,54 | |||
| 2026-01-29 | 13F | IMC-Chicago, LLC | Call | 76.100 | -3,06 | 3.323 | 0,88 | |||
| 2026-02-17 | 13F | Balyasny Asset Management Llc | 15.654 | 683 | ||||||
| 2025-11-06 | 13F | Candriam Luxembourg S.C.A. | 0 | -100,00 | 0 | |||||
| 2026-02-06 | 13F | Global Retirement Partners, LLC | 4.395 | -33,41 | 192 | -30,80 | ||||
| 2026-02-13 | 13F | PCM Encore, LLC | 10.359 | 452 | ||||||
| 2026-04-13 | 13F | IFP Advisors, Inc | 158.117 | -67,89 | 7.179 | -66,61 | ||||
| 2026-01-23 | 13F | Diversify Advisory Services, LLC | 20.782 | 8,68 | 1.027 | 41,32 | ||||
| 2026-02-09 | 13F | AIA Group Ltd | 13.066 | 570 | ||||||
| 2026-02-06 | 13F | HighTower Advisors, LLC | 104.259 | -23,19 | 4.552 | -20,09 | ||||
| 2026-02-09 | 13F | Harbour Investments, Inc. | 38 | 90,00 | 2 | |||||
| 2026-02-13 | 13F | Stifel Financial Corp | 45.687 | -8,44 | 1.995 | -4,78 | ||||
| 2026-02-10 | 13F | Foundations Investment Advisors, LLC | 19.139 | 836 | ||||||
| 2025-11-12 | 13F | Aster Capital Management (DIFC) Ltd | 0 | -100,00 | 0 | |||||
| 2026-02-17 | 13F | Schonfeld Strategic Advisors LLC | 39.643 | -73,36 | 1.731 | -72,29 | ||||
| 2026-01-14 | 13F | ORG Partners LLC | 412 | 37,33 | 18 | 41,67 | ||||
| 2026-02-10 | 13F | Close Asset Management Ltd | 1.900 | 0,00 | 0 | |||||
| 2025-11-14 | 13F | Qube Research & Technologies Ltd | 0 | -100,00 | 0 | |||||
| 2026-01-23 | 13F | Westside Investment Management, Inc. | 1.210 | 0,00 | 53 | 4,00 | ||||
| 2026-02-12 | 13F | Wealthspire Advisors, LLC | 0 | -100,00 | 0 | |||||
| 2026-02-02 | 13F | Alliance Wealth Advisors, LLC /UT | 0 | -100,00 | 0 | |||||
| 2026-02-13 | 13F | Van Eck Associates Corp | 35.483.903 | 3,44 | 1.549 | 7,64 | ||||
| 2026-02-13 | 13F | Ingalls & Snyder Llc | 6.096 | -0,73 | 0 | |||||
| 2026-02-19 | 13F | Atomi Financial Group, Inc. | 32.561 | 4,32 | 1.422 | 8,56 | ||||
| 2026-02-05 | 13F | Thrivent Financial For Lutherans | 103.142 | 0,34 | 5 | 0,00 | ||||
| 2026-04-22 | 13F | Qp Wealth Management, Llc | 6.428 | 292 | ||||||
| 2026-02-12 | 13F | Colonial Trust Advisors | 350 | 0,00 | 15 | 7,14 | ||||
| 2026-02-13 | 13F | Global Strategic Management Inc | 0 | -100,00 | 0 | |||||
| 2026-04-13 | 13F | True Wealth Design, LLC | 110 | -10,57 | 5 | -20,00 | ||||
| 2026-02-13 | 13F | Baird Financial Group, Inc. | 26.679 | 0,00 | 1.165 | 4,02 | ||||
| 2026-02-13 | 13F | Ubs Asset Management Americas Inc | 708 | -99,93 | 31 | -99,93 | ||||
| 2025-11-14 | 13F | Cubist Systematic Strategies, LLC | Put | 14.000 | -28,21 | 587 | 27,33 | |||
| 2026-02-10 | 13F/A | Northwestern Mutual Wealth Management Co | 949 | 10,22 | 41 | 13,89 | ||||
| 2025-11-14 | 13F | Cubist Systematic Strategies, LLC | Call | 96.300 | 4.041 | |||||
| 2026-01-29 | 13F | Aprio Wealth Management, LLC | 13.272 | 4,30 | 579 | 8,63 | ||||
| 2026-02-09 | 13F | Royce & Associates Lp | 386.500 | 0,00 | 16.875 | 4,05 | ||||
| 2026-04-21 | 13F | PharVision Advisers, LLC | 0 | -100,00 | 0 |